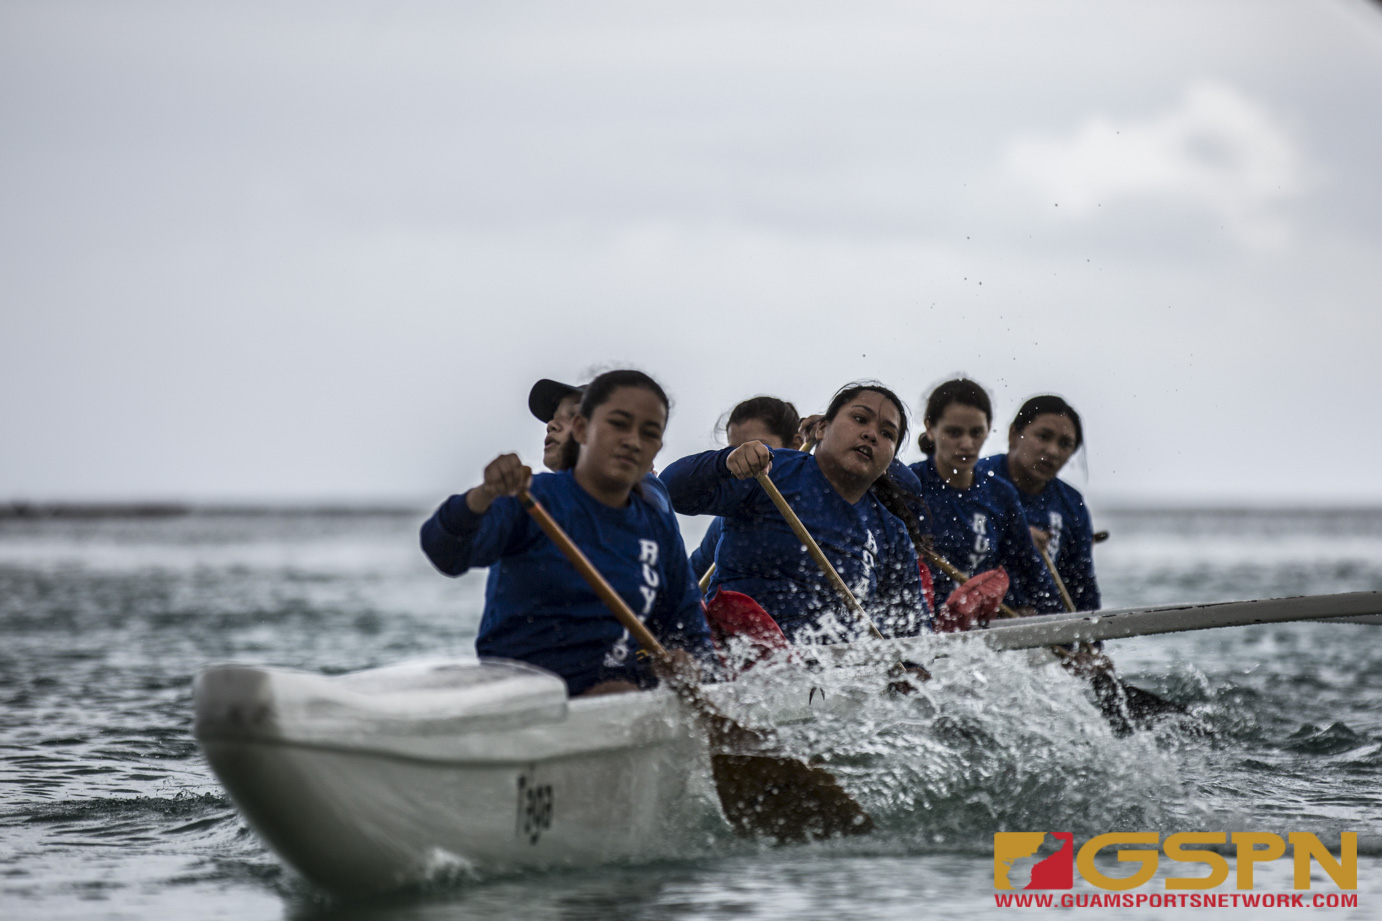
Saturday morning was a Jollibee opening celebration for most, but not for Guam’s paddlers as they officially kicked off their 2019 season with Meet 1 at Matapang Beach. Check out the full results and photos from GSPN’s Michael Ebio below!
Top Results
| 500mA | Winner | Winning time | Total racers | |
| |
GW Geckos | 2:35.5 | 62 | |
| |
JFK Islanders | 3:02.9 | 11 | |
| |
GH Panthers | 2:49.8 | 10 | |
| |
GH Panthers | 2:54.5 | 12 | |
| |
TH Titans | 2:59.8 | 11 | |
| |
GW Geckos | 2:35.5 | 9 | |
| |
TH Titans | 2:51.2 | 9 | |
| 500B | Winner | Winning time | Total racers | |
| |
GW Geckos | 2:42.3 | 63 | |
| |
SSHS Sharks | 3:12.5 | 11 | |
| |
GH Panthers | 2:52.5 | 11 | |
| |
JFK Islanders | 3:06.4 | 11 | |
| |
SSHS Sharks | 3:08.2 | 11 | |
| |
GW Geckos | 2:42.3 | 9 | |
| |
OK Bulldogs | 2:57.0 | 10 | |
PHOTO GALLERY BROUGHT TO YOU BY:
![]()
")
(photo by Bout It Productions)
")
(photo by Bout It Productions)
")
(photo by Bout It Productions)
")
(photo by Bout It Productions)
")
(photo by Bout It Productions)
")
(photo by Bout It Productions)
")
(photo by Bout It Productions)
")
(photo by Bout It Productions)
")
(photo by Bout It Productions)
")
(photo by Bout It Productions)
")
(photo by Bout It Productions)
")
(photo by Bout It Productions)
")
(photo by Bout It Productions)
")
(photo by Bout It Productions)
(photo by Bout It Productions)
")
(photo by Bout It Productions)
")
(photo by Bout It Productions)
")
(photo by Bout It Productions)
")
(photo by Bout It Productions)
")
(photo by Bout It Productions)
")
(photo by Bout It Productions)
")
(photo by Bout It Productions)
")
(photo by Bout It Productions)
")
(photo by Bout It Productions)
")
(photo by Bout It Productions)
")
(photo by Bout It Productions)
")
(photo by Bout It Productions)
")
(photo by Bout It Productions)
")
(photo by Bout It Productions)
FULL RESULTS
|
500B – Overall
|
||||||||||
| Place | Bib | Name | Distance | Category | Time | Difference | % Back | % Winning | % Average | % Median |
| 1 | 2039 | GW Geckos | 500B | Sotteru | 2:42.3 | – | – | 100% | 15.88% | 14.58% |
| 2 | 2035 |
SSHS Sharks
|
500B | Sotteru | 2:45.0 | +0:02.7 | +1.66% | 98.36% | 14.48% | 13.16% |
| 3 | 2038 | TH Titans | 500B | Sotteru | 2:51.7 | +0:09.4 | +5.79% | 94.53% | 11.00% | 9.63% |
| 4 | 2034 |
JFK Islanders
|
500B | Sotteru | 2:52.4 | +0:10.1 | +6.22% | 94.14% | 10.64% | 9.26% |
| 5 | 2021 |
GH Panthers
|
500B |
Manhoben Lalahi
|
2:52.5 | +0:10.2 | +6.28% | 94.09% | 10.59% | 9.21% |
| 6 | 2019 |
JFK Islanders
|
500B |
Manhoben Lalahi
|
2:56.8 | +0:14.5 | +8.93% | 91.80% | 8.36% | 6.95% |
| 7 | 2055 |
OK Bulldogs
|
500B |
Sotteru Mixed
|
2:57.0 | +0:14.7 | +9.06% | 91.69% | 8.26% | 6.84% |
| 8 | 2012 |
SSHS Sharks
|
500B |
Manhoben Lalahi
|
2:57.6 | +0:15.3 | +9.43% | 91.39% | 7.95% | 6.53% |
| 9 | 2061 | TH Titans | 500B |
Sotteru Mixed
|
2:58.6 | +0:16.3 | +10.04% | 90.87% | 7.43% | 6.00% |
| 10 | 2058 |
JFK Islanders
|
500B |
Sotteru Mixed
|
2:58.9 | +0:16.6 | +10.23% | 90.72% | 7.27% | 5.84% |
| 11 | 2062 |
SSHS Sharks
|
500B |
Sotteru Mixed
|
2:59.0 | +0:16.7 | +10.29% | 90.67% | 7.22% | 5.79% |
| 12 | 2016 | TH Titans | 500B |
Manhoben Lalahi
|
3:00.2 | +0:17.9 | +11.03% | 90.07% | 6.60% | 5.16% |
| 13 | 2037 |
OK Bulldogs
|
500B | Sotteru | 3:00.6 | +0:18.3 | +11.28% | 89.87% | 6.39% | 4.95% |
| 14 | 2036 | FD Friars | 500B | Sotteru | 3:02.3 | +0:20.0 | +12.32% | 89.03% | 5.51% | 4.05% |
| 15 | 2014 | FD Friars | 500B |
Manhoben Lalahi
|
3:02.6 | +0:20.3 | +12.51% | 88.88% | 5.35% | 3.89% |
| 16 | 2018 |
SH Dolphins
|
500B |
Manhoben Lalahi
|
3:03.0 | +0:20.7 | +12.75% | 88.69% | 5.15% | 3.68% |
| 17 | 2040 | ND Royals | 500B | Sotteru | 3:04.5 | +0:22.2 | +13.68% | 87.97% | 4.37% | 2.89% |
| 18 | 2017 | ND Royals | 500B |
Manhoben Lalahi
|
3:05.6 | +0:23.3 | +14.36% | 87.45% | 3.80% | 2.32% |
| 19 | 2049 |
JFK Islanders
|
500B |
Manhoben Mixed
|
3:06.4 | +0:24.1 | +14.85% | 87.07% | 3.38% | 1.89% |
| 20 | 2057 | SJ Knights | 500B |
Sotteru Mixed
|
3:06.9 | +0:24.6 | +15.16% | 86.84% | 3.13% | 1.63% |
| 21 | 2050 | GW Geckos | 500B |
Manhoben Mixed
|
3:07.2 | +0:24.9 | +15.34% | 86.70% | 2.97% | 1.47% |
| 22 | 2059 |
GH Panthers
|
500B |
Sotteru Mixed
|
3:08.1 | +0:25.8 | +15.90% | 86.28% | 2.50% | 1.00% |
| 23 | 2024 |
SSHS Sharks
|
500B | Sottera | 3:08.2 | +0:25.9 | +15.96% | 86.24% | 2.45% | 0.95% |
| 24 | 2051 | TH Titans | 500B |
Manhoben Mixed
|
3:08.9 | +0:26.6 | +16.39% | 85.92% | 2.09% | 0.58% |
| 25 | 2020 | GW Geckos | 500B |
Manhoben Lalahi
|
3:09.5 | +0:27.2 | +16.76% | 85.65% | 1.78% | 0.26% |
| 26 | 2041 |
GH Panthers
|
500B | Sotteru | 3:09.7 | +0:27.4 | +16.88% | 85.56% | 1.67% | 0.16% |
| 27 | 2015 |
OK Bulldogs
|
500B |
Manhoben Lalahi
|
3:10.0 | +0:27.7 | +17.07% | 85.42% | 1.52% | 0.00% |
| 27 | 2025 |
AOLG Cougars
|
500B | Sottera | 3:10.0 | +0:27.7 | +17.07% | 85.42% | 1.52% | 0.00% |
| 29 | 2028 |
OK Bulldogs
|
500B | Sottera | 3:12.1 | +0:29.8 | +18.36% | 84.49% | 0.43% | -1.11% |
| 30 | 2003 |
SSHS Sharks
|
500B |
Manhoben Famalaoan
|
3:12.5 | +0:30.2 | +18.61% | 84.31% | 0.22% | -1.32% |
| 31 | 2052 |
SH Dolphins
|
500B |
Manhoben Mixed
|
3:12.6 | +0:30.3 | +18.67% | 84.27% | 0.17% | -1.37% |
| 32 | 2046 |
GH Panthers
|
500B |
Manhoben Mixed
|
3:12.8 | +0:30.5 | +18.79% | 84.18% | 0.07% | -1.47% |
| 33 | 2043 | SJ Knights | 500B |
Manhoben Mixed
|
3:15.0 | +0:32.7 | +20.15% | 83.23% | -1.07% | -2.63% |
| 34 | 2054 | GW Geckos | 500B |
Sotteru Mixed
|
3:15.9 | +0:33.6 | +20.70% | 82.85% | -1.54% | -3.11% |
| 34 | 2007 | GW Geckos | 500B |
Manhoben Famalaoan
|
3:15.9 | +0:33.6 | +20.70% | 82.85% | -1.54% | -3.11% |
| 36 | 2004 |
GH Panthers
|
500B |
Manhoben Famalaoan
|
3:16.1 | +0:33.8 | +20.83% | 82.76% | -1.64% | -3.21% |
| 37 | 2060 | FD/AOLG | 500B |
Sotteru Mixed
|
3:17.6 | +0:35.3 | +21.75% | 82.14% | -2.42% | -4.00% |
| 37 | 2027 |
JFK Islanders
|
500B | Sottera | 3:17.6 | +0:35.3 | +21.75% | 82.14% | -2.42% | -4.00% |
| 39 | 2045 |
SSHS Sharks
|
500B |
Manhoben Mixed
|
3:18.0 | +0:35.7 | +22.00% | 81.97% | -2.63% | -4.21% |
| 40 | 2031 | SJ Knights | 500B | Sottera | 3:19.6 | +0:37.3 | +22.98% | 81.31% | -3.46% | -5.05% |
| 41 | 2056 | ND Royals | 500B |
Sotteru Mixed
|
3:19.7 | +0:37.4 | +23.04% | 81.27% | -3.51% | -5.11% |
| 42 | 2047 |
OK Bulldogs
|
500B |
Manhoben Mixed
|
3:19.9 | +0:37.6 | +23.17% | 81.19% | -3.61% | -5.21% |
| 43 | 2008 | TH Titans | 500B |
Manhoben Famalaoan
|
3:21.9 | +0:39.6 | +24.40% | 80.39% | -4.65% | -6.26% |
| 44 | 2010 |
JFK Islanders
|
500B |
Manhoben Famalaoan
|
3:22.2 | +0:39.9 | +24.58% | 80.27% | -4.81% | -6.42% |
| 45 | 2030 |
SH Dolphins
|
500B | Sottera | 3:22.7 | +0:40.4 | +24.89% | 80.07% | -5.06% | -6.68% |
| 46 | 2029 | GW Geckos | 500B | Sottera | 3:23.1 | +0:40.8 | +25.14% | 79.91% | -5.27% | -6.89% |
| 47 | 2044 | ND Royals | 500B |
Manhoben Mixed
|
3:26.0 | +0:43.7 | +26.93% | 78.79% | -6.77% | -8.42% |
| 48 | 2032 | ND Royals | 500B | Sottera | 3:29.3 | +0:47.0 | +28.96% | 77.54% | -8.49% | -10.16% |
| 49 | 2023 |
GH Panthers
|
500B | Sottera | 3:34.7 | +0:52.4 | +32.29% | 75.59% | -11.28% | -13.00% |
| 50 | 2009 |
OK Bulldogs
|
500B |
Manhoben Famalaoan
|
3:42.8 | +1:00.5 | +37.28% | 72.85% | -15.48% | -17.26% |
| 51 | 2005 |
SH Dolphins
|
500B |
Manhoben Famalaoan
|
3:43.5 | +1:01.2 | +37.71% | 72.62% | -15.85% | -17.63% |
| 52 | 2048 | FD/AOLG | 500B |
Manhoben Mixed
|
3:44.1 | +1:01.8 | +38.08% | 72.42% | -16.16% | -17.95% |
| 53 | 2002 | ND Royals | 500B |
Manhoben Famalaoan
|
3:45.5 | +1:03.2 | +38.94% | 71.97% | -16.88% | -18.68% |
| 54 | 2001 | SJ Knights | 500B |
Manhoben Famalaoan
|
3:47.0 | +1:04.7 | +39.86% | 71.50% | -17.66% | -19.47% |
| 55 | 2006 |
AOLG Cougars
|
500B |
Manhoben Famalaoan
|
3:47.5 | +1:05.2 | +40.17% | 71.34% | -17.92% | -19.74% |
| – | 2011 | OPEN MF | 500B |
Manhoben Famalaoan
|
– | – | – | – | – | – |
| – | 2013 | SJ Knights | 500B |
Manhoben Lalahi
|
– | – | – | – | – | – |
| – | 2022 | OPEN ML | 500B |
Manhoben Lalahi
|
– | – | – | – | – | – |
| – | 2026 | TH Titans | 500B | Sottera | – | – | – | – | – | – |
| – | 2033 | OPEN SA | 500B | Sottera | – | – | – | – | – | – |
| – | 2042 | OPEN SU | 500B | Sotteru | – | – | – | – | – | – |
| – | 2053 | OPEN MM | 500B |
Manhoben Mixed
|
– | – | – | – | – | – |
| – | 2063 | OPEN SM | 500B |
Sotteru Mixed
|
– | – | – | – | – | – |
|
500mA – Overall
|
||||||||||
| Place | Bib | Name | Distance | Category | Time | Difference | % Back | % Winning | % Average | % Median |
| 1 | 1035 | GW Geckos | 500mA | Sotteru | 2:35.5 | – | – | 100% | 16.53% | 15.85% |
| 2 | 1038 |
SSHS Sharks
|
500mA | Sotteru | 2:41.5 | +0:06.0 | +3.86% | 96.28% | 13.31% | 12.61% |
| 3 | 1037 | TH Titans | 500mA | Sotteru | 2:41.9 | +0:06.4 | +4.12% | 96.05% | 13.10% | 12.39% |
| 4 | 1040 |
JFK Islanders
|
500mA | Sotteru | 2:42.6 | +0:07.1 | +4.57% | 95.63% | 12.72% | 12.01% |
| 5 | 1041 | FD Friars | 500mA | Sotteru | 2:49.7 | +0:14.2 | +9.13% | 91.63% | 8.91% | 8.17% |
| 6 | 1012 |
GH Panthers
|
500mA |
Manhoben Lalahi
|
2:49.8 | +0:14.3 | +9.20% | 91.58% | 8.86% | 8.12% |
| 7 | 1055 | TH Titans | 500mA |
Sotteru Mixed
|
2:51.2 | +0:15.7 | +10.10% | 90.83% | 8.11% | 7.36% |
| 8 | 1054 |
SSHS Sharks
|
500mA |
Sotteru Mixed
|
2:52.3 | +0:16.8 | +10.80% | 90.25% | 7.52% | 6.76% |
| 9 | 1015 |
SSHS Sharks
|
500mA |
Manhoben Lalahi
|
2:52.6 | +0:17.1 | +11.00% | 90.09% | 7.36% | 6.60% |
| 10 | 1034 |
OK Bulldogs
|
500mA | Sotteru | 2:53.3 | +0:17.8 | +11.45% | 89.73% | 6.98% | 6.22% |
| 11 | 1060 |
JFK Islanders
|
500mA |
Sotteru Mixed
|
2:53.5 | +0:18.0 | +11.58% | 89.63% | 6.87% | 6.11% |
| 12 | 1046 |
GH Panthers
|
500mA |
Manhoben Mixed
|
2:54.5 | +0:19.0 | +12.22% | 89.11% | 6.34% | 5.57% |
| 13 | 1019 | TH Titans | 500mA |
Manhoben Lalahi
|
2:54.6 | +0:19.1 | +12.28% | 89.06% | 6.28% | 5.52% |
| 14 | 1058 |
OK Bulldogs
|
500mA |
Sotteru Mixed
|
2:54.9 | +0:19.4 | +12.48% | 88.91% | 6.12% | 5.36% |
| 15 | 1016 |
JFK Islanders
|
500mA |
Manhoben Lalahi
|
2:55.7 | +0:20.2 | +12.99% | 88.50% | 5.69% | 4.92% |
| 16 | 1017 |
OK Bulldogs
|
500mA |
Manhoben Lalahi
|
2:57.2 | +0:21.7 | +13.95% | 87.75% | 4.89% | 4.11% |
| 17 | 1059 | SJ Knights | 500mA |
Sotteru Mixed
|
2:59.1 | +0:23.6 | +15.18% | 86.82% | 3.87% | 3.08% |
| 18 | 1039 |
GH Panthers
|
500mA | Sotteru | 2:59.5 | +0:24.0 | +15.43% | 86.63% | 3.65% | 2.87% |
| 19 | 1056 | FD/AOLG | 500mA |
Sotteru Mixed
|
2:59.7 | +0:24.2 | +15.56% | 86.53% | 3.54% | 2.76% |
| 20 | 1027 | TH Titans | 500mA | Sottera | 2:59.8 | +0:24.3 | +15.63% | 86.48% | 3.49% | 2.71% |
| 21 | 1024 |
SSHS Sharks
|
500mA | Sottera | 3:00.6 | +0:25.1 | +16.14% | 86.10% | 3.06% | 2.27% |
| 22 | 1026 |
AOLG Cougars
|
500mA | Sottera | 3:01.4 | +0:25.9 | +16.66% | 85.72% | 2.63% | 1.84% |
| 23 | 1057 | ND Royals | 500mA |
Sotteru Mixed
|
3:01.6 | +0:26.1 | +16.78% | 85.63% | 2.52% | 1.73% |
| 24 | 1051 |
SSHS Sharks
|
500mA |
Manhoben Mixed
|
3:02.2 | +0:26.7 | +17.17% | 85.35% | 2.20% | 1.41% |
| 25 | 1014 | ND Royals | 500mA |
Manhoben Lalahi
|
3:02.5 | +0:27.0 | +17.36% | 85.21% | 2.04% | 1.24% |
| 26 | 1007 |
JFK Islanders
|
500mA |
Manhoben Famalaoan
|
3:02.9 | +0:27.4 | +17.62% | 85.02% | 1.83% | 1.03% |
| 27 | 1062 | GW Geckos | 500mA |
Sotteru Mixed
|
3:03.3 | +0:27.8 | +17.88% | 84.83% | 1.61% | 0.81% |
| 28 | 1061 |
GH Panthers
|
500mA |
Sotteru Mixed
|
3:04.4 | +0:28.9 | +18.59% | 84.33% | 1.02% | 0.22% |
| 29 | 1030 |
JFK Islanders
|
500mA | Sottera | 3:05.2 | +0:29.7 | +19.10% | 83.96% | 0.59% | -0.22% |
| 30 | 1005 |
SSHS Sharks
|
500mA |
Manhoben Famalaoan
|
3:05.3 | +0:29.8 | +19.16% | 83.92% | 0.54% | -0.27% |
| 30 | 1036 | ND Royals | 500mA | Sotteru | 3:05.3 | +0:29.8 | +19.16% | 83.92% | 0.54% | -0.27% |
| 32 | 1048 | SJ Knights | 500mA |
Manhoben Mixed
|
3:05.7 | +0:30.2 | +19.42% | 83.74% | 0.32% | -0.49% |
| 33 | 1013 | GW Geckos | 500mA |
Manhoben Lalahi
|
3:06.3 | +0:30.8 | +19.81% | 83.47% | 0.00% | -0.81% |
| 33 | 1050 | TH Titans | 500mA |
Manhoben Mixed
|
3:06.3 | +0:30.8 | +19.81% | 83.47% | 0.00% | -0.81% |
| 35 | 1044 | GW Geckos | 500mA |
Manhoben Mixed
|
3:07.3 | +0:31.8 | +20.45% | 83.02% | -0.53% | -1.35% |
| 36 | 1049 |
OK Bulldogs
|
500mA |
Manhoben Mixed
|
3:07.4 | +0:31.9 | +20.51% | 82.98% | -0.59% | -1.41% |
| 37 | 1063 | Jfk | 500mA |
Manhoben Mixed
|
3:07.5 | +0:32.0 | +20.58% | 82.93% | -0.64% | -1.46% |
| 38 | 1018 |
SH Dolphins
|
500mA |
Manhoben Lalahi
|
3:09.6 | +0:34.1 | +21.93% | 82.01% | -1.77% | -2.60% |
| 39 | 1021 | FD Friars | 500mA |
Manhoben Lalahi
|
3:11.5 | +0:36.0 | +23.15% | 81.20% | -2.79% | -3.63% |
| 40 | 1028 |
OK Bulldogs
|
500mA | Sottera | 3:13.2 | +0:37.7 | +24.24% | 80.49% | -3.70% | -4.55% |
| 41 | 1032 |
GH Panthers
|
500mA | Sottera | 3:14.3 | +0:38.8 | +24.95% | 80.03% | -4.29% | -5.14% |
| 42 | 1006 | GW Geckos | 500mA |
Manhoben Famalaoan
|
3:14.4 | +0:38.9 | +25.02% | 79.99% | -4.35% | -5.19% |
| 43 | 1008 | TH Titans | 500mA |
Manhoben Famalaoan
|
3:14.9 | +0:39.4 | +25.34% | 79.78% | -4.61% | -5.47% |
| 44 | 1009 |
GH Panthers
|
500mA |
Manhoben Famalaoan
|
3:15.4 | +0:39.9 | +25.66% | 79.58% | -4.88% | -5.74% |
| 45 | 1025 | ND Royals | 500mA | Sottera | 3:16.5 | +0:41.0 | +26.37% | 79.13% | -5.47% | -6.33% |
| 46 | 1031 | GW Geckos | 500mA | Sottera | 3:17.7 | +0:42.2 | +27.14% | 78.65% | -6.12% | -6.98% |
| 47 | 1023 | SJ Knights | 500mA | Sottera | 3:17.8 | +0:42.3 | +27.20% | 78.61% | -6.17% | -7.03% |
| 48 | 1045 | ND Royals | 500mA |
Manhoben Mixed
|
3:20.4 | +0:44.9 | +28.87% | 77.59% | -7.57% | -8.44% |
| 49 | 1029 |
SH Dolphins
|
500mA | Sottera | 3:21.1 | +0:45.6 | +29.32% | 77.32% | -7.94% | -8.82% |
| 50 | 1047 | FD/AOLG | 500mA |
Manhoben Mixed
|
3:28.9 | +0:53.4 | +34.34% | 74.44% | -12.13% | -13.04% |
| 51 | 1010 |
OK Bulldogs
|
500mA |
Manhoben Famalaoan
|
3:31.3 | +0:55.8 | +35.88% | 73.59% | -13.42% | -14.34% |
| 52 | 1003 | SJ Knights | 500mA |
Manhoben Famalaoan
|
3:32.9 | +0:57.4 | +36.91% | 73.04% | -14.28% | -15.21% |
| 53 | 1043 |
SH Dolphins
|
500mA |
Manhoben Mixed
|
3:34.0 | +0:58.5 | +37.62% | 72.66% | -14.87% | -15.80% |
| 54 | 1002 |
AOLG Cougars
|
500mA |
Manhoben Famalaoan
|
3:39.1 | +1:03.6 | +40.90% | 70.97% | -17.60% | -18.56% |
| 55 | 1004 |
SH Dolphins
|
500mA |
Manhoben Famalaoan
|
3:40.3 | +1:04.8 | +41.67% | 70.59% | -18.25% | -19.21% |
| 56 | 1001 | ND Royals | 500mA |
Manhoben Famalaoan
|
3:45.6 | +1:10.1 | +45.08% | 68.93% | -21.09% | -22.08% |
| – | 1011 | OPEN MF | 500mA |
Manhoben Famalaoan
|
– | – | – | – | – | – |
| – | 1022 | OPEN ML | 500mA |
Manhoben Lalahi
|
– | – | – | – | – | – |
| – | 1033 | OPEN SA | 500mA | Sottera | – | – | – | – | – | – |
| – | 1042 | OPEN SU | 500mA | Sotteru | – | – | – | – | – | – |
| – | 1052 | FD/AOLG. | 500mA |
Manhoben Mixed
|
– | – | – | – | – | – |
| – | 1053 | OPEN MM | 500mA |
Manhoben Mixed
|
– | – | – | – | – | – |
| – | 1020 | SJ Knights | 500mA |
Manhoben Lalahi
|
DNS | – | – | – | – | – |
|
500B – Manhoben Famalaoan
|
||||||||||
| Place | Bib | Name | Distance | Category | Time | Difference | % Back | % Winning | % Average | % Median |
| 1 | 2003 |
SSHS Sharks
|
500B |
Manhoben Famalaoan
|
3:12.5 | – | – | 100% | 8.98% | 9.41% |
| 2 | 2007 | GW Geckos | 500B |
Manhoben Famalaoan
|
3:15.9 | +0:03.4 | +1.77% | 98.26% | 7.37% | 7.81% |
| 3 | 2004 |
GH Panthers
|
500B |
Manhoben Famalaoan
|
3:16.1 | +0:03.6 | +1.87% | 98.16% | 7.28% | 7.72% |
| 4 | 2008 | TH Titans | 500B |
Manhoben Famalaoan
|
3:21.9 | +0:09.4 | +4.88% | 95.34% | 4.53% | 4.99% |
| 5 | 2010 |
JFK Islanders
|
500B |
Manhoben Famalaoan
|
3:22.2 | +0:09.7 | +5.04% | 95.20% | 4.39% | 4.85% |
| 6 | 2009 |
OK Bulldogs
|
500B |
Manhoben Famalaoan
|
3:42.8 | +0:30.3 | +15.74% | 86.40% | -5.35% | -4.85% |
| 7 | 2005 |
SH Dolphins
|
500B |
Manhoben Famalaoan
|
3:43.5 | +0:31.0 | +16.10% | 86.13% | -5.68% | -5.18% |
| 8 | 2002 | ND Royals | 500B |
Manhoben Famalaoan
|
3:45.5 | +0:33.0 | +17.14% | 85.37% | -6.62% | -6.12% |
| 9 | 2001 | SJ Knights | 500B |
Manhoben Famalaoan
|
3:47.0 | +0:34.5 | +17.92% | 84.80% | -7.33% | -6.82% |
| 10 | 2006 |
AOLG Cougars
|
500B |
Manhoben Famalaoan
|
3:47.5 | +0:35.0 | +18.18% | 84.62% | -7.57% | -7.06% |
| – | 2011 | OPEN MF | 500B |
Manhoben Famalaoan
|
– | – | – | – | – | – |
|
500B – Manhoben Lalahi
|
||||||||||
| Place | Bib | Name | Distance | Category | Time | Difference | % Back | % Winning | % Average | % Median |
| 1 | 2021 |
GH Panthers
|
500B |
Manhoben Lalahi
|
2:52.5 | – | – | 100% | 5.21% | 5.53% |
| 2 | 2019 |
JFK Islanders
|
500B |
Manhoben Lalahi
|
2:56.8 | +0:04.3 | +2.49% | 97.57% | 2.85% | 3.18% |
| 3 | 2012 |
SSHS Sharks
|
500B |
Manhoben Lalahi
|
2:57.6 | +0:05.1 | +2.96% | 97.13% | 2.41% | 2.74% |
| 4 | 2016 | TH Titans | 500B |
Manhoben Lalahi
|
3:00.2 | +0:07.7 | +4.46% | 95.73% | 0.98% | 1.31% |
| 5 | 2014 | FD Friars | 500B |
Manhoben Lalahi
|
3:02.6 | +0:10.1 | +5.86% | 94.47% | -0.34% | 0.00% |
| 6 | 2018 |
SH Dolphins
|
500B |
Manhoben Lalahi
|
3:03.0 | +0:10.5 | +6.09% | 94.26% | -0.56% | -0.22% |
| 7 | 2017 | ND Royals | 500B |
Manhoben Lalahi
|
3:05.6 | +0:13.1 | +7.59% | 92.94% | -1.99% | -1.64% |
| 8 | 2020 | GW Geckos | 500B |
Manhoben Lalahi
|
3:09.5 | +0:17.0 | +9.86% | 91.03% | -4.13% | -3.78% |
| 9 | 2015 |
OK Bulldogs
|
500B |
Manhoben Lalahi
|
3:10.0 | +0:17.5 | +10.14% | 90.79% | -4.41% | -4.05% |
| – | 2013 | SJ Knights | 500B |
Manhoben Lalahi
|
– | – | – | – | – | – |
| – | 2022 | OPEN ML | 500B |
Manhoben Lalahi
|
– | – | – | – | – | – |
|
500B – Manhoben Mixed
|
||||||||||
| Place | Bib | Name | Distance | Category | Time | Difference | % Back | % Winning | % Average | % Median |
| 1 | 2049 |
JFK Islanders
|
500B |
Manhoben Mixed
|
3:06.4 | – | – | 100% | 5.42% | 3.87% |
| 2 | 2050 | GW Geckos | 500B |
Manhoben Mixed
|
3:07.2 | +0:00.8 | +0.43% | 99.57% | 5.02% | 3.46% |
| 3 | 2051 | TH Titans | 500B |
Manhoben Mixed
|
3:08.9 | +0:02.5 | +1.34% | 98.68% | 4.16% | 2.58% |
| 4 | 2052 |
SH Dolphins
|
500B |
Manhoben Mixed
|
3:12.6 | +0:06.2 | +3.33% | 96.78% | 2.28% | 0.67% |
| 5 | 2046 |
GH Panthers
|
500B |
Manhoben Mixed
|
3:12.8 | +0:06.4 | +3.43% | 96.68% | 2.18% | 0.57% |
| 6 | 2043 | SJ Knights | 500B |
Manhoben Mixed
|
3:15.0 | +0:08.6 | +4.61% | 95.59% | 1.06% | -0.57% |
| 7 | 2045 |
SSHS Sharks
|
500B |
Manhoben Mixed
|
3:18.0 | +0:11.6 | +6.22% | 94.14% | -0.46% | -2.11% |
| 8 | 2047 |
OK Bulldogs
|
500B |
Manhoben Mixed
|
3:19.9 | +0:13.5 | +7.24% | 93.25% | -1.43% | -3.09% |
| 9 | 2044 | ND Royals | 500B |
Manhoben Mixed
|
3:26.0 | +0:19.6 | +10.52% | 90.49% | -4.52% | -6.24% |
| 10 | 2048 | FD/AOLG | 500B |
Manhoben Mixed
|
3:44.1 | +0:37.7 | +20.23% | 83.18% | -13.70% | -15.58% |
| – | 2053 | OPEN MM | 500B |
Manhoben Mixed
|
– | – | – | – | – | – |
|
500B – Sottera
|
||||||||||
| Place | Bib | Name | Distance | Category | Time | Difference | % Back | % Winning | % Average | % Median |
| 1 | 2024 |
SSHS Sharks
|
500B | Sottera | 3:08.2 | – | – | 100% | 5.76% | 5.71% |
| 2 | 2025 |
AOLG Cougars
|
500B | Sottera | 3:10.0 | +0:01.8 | +0.96% | 99.05% | 4.86% | 4.81% |
| 3 | 2028 |
OK Bulldogs
|
500B | Sottera | 3:12.1 | +0:03.9 | +2.07% | 97.97% | 3.81% | 3.76% |
| 4 | 2027 |
JFK Islanders
|
500B | Sottera | 3:17.6 | +0:09.4 | +4.99% | 95.24% | 1.05% | 1.00% |
| 5 | 2031 | SJ Knights | 500B | Sottera | 3:19.6 | +0:11.4 | +6.06% | 94.29% | 0.05% | 0.00% |
| 6 | 2030 |
SH Dolphins
|
500B | Sottera | 3:22.7 | +0:14.5 | +7.70% | 92.85% | -1.50% | -1.55% |
| 7 | 2029 | GW Geckos | 500B | Sottera | 3:23.1 | +0:14.9 | +7.92% | 92.66% | -1.70% | -1.75% |
| 8 | 2032 | ND Royals | 500B | Sottera | 3:29.3 | +0:21.1 | +11.21% | 89.92% | -4.81% | -4.86% |
| 9 | 2023 |
GH Panthers
|
500B | Sottera | 3:34.7 | +0:26.5 | +14.08% | 87.66% | -7.51% | -7.57% |
| – | 2026 | TH Titans | 500B | Sottera | – | – | – | – | – | – |
| – | 2033 | OPEN SA | 500B | Sottera | – | – | – | – | – | – |
|
500B – Sotteru
|
||||||||||
| Place | Bib | Name | Distance | Category | Time | Difference | % Back | % Winning | % Average | % Median |
| 1 | 2039 | GW Geckos | 500B | Sotteru | 2:42.3 | – | – | 100% | 7.82% | 8.05% |
| 2 | 2035 |
SSHS Sharks
|
500B | Sotteru | 2:45.0 | +0:02.7 | +1.66% | 98.36% | 6.28% | 6.52% |
| 3 | 2038 | TH Titans | 500B | Sotteru | 2:51.7 | +0:09.4 | +5.79% | 94.53% | 2.48% | 2.72% |
| 4 | 2034 |
JFK Islanders
|
500B | Sotteru | 2:52.4 | +0:10.1 | +6.22% | 94.14% | 2.08% | 2.32% |
| 5 | 2037 |
OK Bulldogs
|
500B | Sotteru | 3:00.6 | +0:18.3 | +11.28% | 89.87% | -2.58% | -2.32% |
| 6 | 2036 | FD Friars | 500B | Sotteru | 3:02.3 | +0:20.0 | +12.32% | 89.03% | -3.54% | -3.29% |
| 7 | 2040 | ND Royals | 500B | Sotteru | 3:04.5 | +0:22.2 | +13.68% | 87.97% | -4.79% | -4.53% |
| 8 | 2041 |
GH Panthers
|
500B | Sotteru | 3:09.7 | +0:27.4 | +16.88% | 85.56% | -7.75% | -7.48% |
| – | 2042 | OPEN SU | 500B | Sotteru | – | – | – | – | – | – |
|
500B – Sotteru Mixed
|
||||||||||
| Place | Bib | Name | Distance | Category | Time | Difference | % Back | % Winning | % Average | % Median |
| 1 | 2055 |
OK Bulldogs
|
500B |
Sotteru Mixed
|
2:57.0 | – | – | 100% | 5.27% | 5.30% |
| 2 | 2061 | TH Titans | 500B |
Sotteru Mixed
|
2:58.6 | +0:01.6 | +0.90% | 99.10% | 4.42% | 4.44% |
| 3 | 2058 |
JFK Islanders
|
500B |
Sotteru Mixed
|
2:58.9 | +0:01.9 | +1.07% | 98.94% | 4.26% | 4.28% |
| 4 | 2062 |
SSHS Sharks
|
500B |
Sotteru Mixed
|
2:59.0 | +0:02.0 | +1.13% | 98.88% | 4.20% | 4.23% |
| 5 | 2057 | SJ Knights | 500B |
Sotteru Mixed
|
3:06.9 | +0:09.9 | +5.59% | 94.70% | -0.02% | 0.00% |
| 6 | 2059 |
GH Panthers
|
500B |
Sotteru Mixed
|
3:08.1 | +0:11.1 | +6.27% | 94.10% | -0.67% | -0.64% |
| 7 | 2054 | GW Geckos | 500B |
Sotteru Mixed
|
3:15.9 | +0:18.9 | +10.68% | 90.35% | -4.84% | -4.82% |
| 8 | 2060 | FD/AOLG | 500B |
Sotteru Mixed
|
3:17.6 | +0:20.6 | +11.64% | 89.57% | -5.75% | -5.72% |
| 9 | 2056 | ND Royals | 500B |
Sotteru Mixed
|
3:19.7 | +0:22.7 | +12.82% | 88.63% | -6.87% | -6.85% |
| – | 2063 | OPEN SM | 500B |
Sotteru Mixed
|
– | – | – | – | – | – |
|
500mA – Manhoben Famalaoan
|
||||||||||
| Place | Bib | Name | Distance | Category | Time | Difference | % Back | % Winning | % Average | % Median |
| 1 | 1007 |
JFK Islanders
|
500mA |
Manhoben Famalaoan
|
3:02.9 | – | – | 100% | 10.44% | 10.06% |
| 2 | 1005 |
SSHS Sharks
|
500mA |
Manhoben Famalaoan
|
3:05.3 | +0:02.4 | +1.31% | 98.70% | 9.26% | 8.88% |
| 3 | 1006 | GW Geckos | 500mA |
Manhoben Famalaoan
|
3:14.4 | +0:11.5 | +6.29% | 94.08% | 4.80% | 4.40% |
| 4 | 1008 | TH Titans | 500mA |
Manhoben Famalaoan
|
3:14.9 | +0:12.0 | +6.56% | 93.84% | 4.56% | 4.16% |
| 5 | 1009 |
GH Panthers
|
500mA |
Manhoben Famalaoan
|
3:15.4 | +0:12.5 | +6.83% | 93.60% | 4.31% | 3.91% |
| 6 | 1010 |
OK Bulldogs
|
500mA |
Manhoben Famalaoan
|
3:31.3 | +0:28.4 | +15.53% | 86.56% | -3.47% | -3.91% |
| 7 | 1003 | SJ Knights | 500mA |
Manhoben Famalaoan
|
3:32.9 | +0:30.0 | +16.40% | 85.91% | -4.26% | -4.70% |
| 8 | 1002 |
AOLG Cougars
|
500mA |
Manhoben Famalaoan
|
3:39.1 | +0:36.2 | +19.79% | 83.48% | -7.29% | -7.75% |
| 9 | 1004 |
SH Dolphins
|
500mA |
Manhoben Famalaoan
|
3:40.3 | +0:37.4 | +20.45% | 83.02% | -7.88% | -8.34% |
| 10 | 1001 | ND Royals | 500mA |
Manhoben Famalaoan
|
3:45.6 | +0:42.7 | +23.35% | 81.07% | -10.47% | -10.94% |
| – | 1011 | OPEN MF | 500mA |
Manhoben Famalaoan
|
– | – | – | – | – | – |
|
500mA – Manhoben Lalahi
|
||||||||||
| Place | Bib | Name | Distance | Category | Time | Difference | % Back | % Winning | % Average | % Median |
| 1 | 1012 |
GH Panthers
|
500mA |
Manhoben Lalahi
|
2:49.8 | – | – | 100% | 5.66% | 4.18% |
| 2 | 1015 |
SSHS Sharks
|
500mA |
Manhoben Lalahi
|
2:52.6 | +0:02.8 | +1.65% | 98.38% | 4.10% | 2.60% |
| 3 | 1019 | TH Titans | 500mA |
Manhoben Lalahi
|
2:54.6 | +0:04.8 | +2.83% | 97.25% | 2.99% | 1.47% |
| 4 | 1016 |
JFK Islanders
|
500mA |
Manhoben Lalahi
|
2:55.7 | +0:05.9 | +3.47% | 96.64% | 2.38% | 0.85% |
| 5 | 1017 |
OK Bulldogs
|
500mA |
Manhoben Lalahi
|
2:57.2 | +0:07.4 | +4.36% | 95.82% | 1.54% | 0.00% |
| 6 | 1014 | ND Royals | 500mA |
Manhoben Lalahi
|
3:02.5 | +0:12.7 | +7.48% | 93.04% | -1.40% | -2.99% |
| 7 | 1013 | GW Geckos | 500mA |
Manhoben Lalahi
|
3:06.3 | +0:16.5 | +9.72% | 91.14% | -3.51% | -5.14% |
| 8 | 1018 |
SH Dolphins
|
500mA |
Manhoben Lalahi
|
3:09.6 | +0:19.8 | +11.66% | 89.56% | -5.35% | -7.00% |
| 9 | 1021 | FD Friars | 500mA |
Manhoben Lalahi
|
3:11.5 | +0:21.7 | +12.78% | 88.67% | -6.40% | -8.07% |
| – | 1022 | OPEN ML | 500mA |
Manhoben Lalahi
|
– | – | – | – | – | – |
| – | 1020 | SJ Knights | 500mA |
Manhoben Lalahi
|
DNS | – | – | – | – | – |
|
500mA – Manhoben Mixed
|
||||||||||
| Place | Bib | Name | Distance | Category | Time | Difference | % Back | % Winning | % Average | % Median |
| 1 | 1046 |
GH Panthers
|
500mA |
Manhoben Mixed
|
2:54.5 | – | – | 100% | 8.84% | 6.86% |
| 2 | 1051 |
SSHS Sharks
|
500mA |
Manhoben Mixed
|
3:02.2 | +0:07.7 | +4.41% | 95.77% | 4.82% | 2.75% |
| 3 | 1048 | SJ Knights | 500mA |
Manhoben Mixed
|
3:05.7 | +0:11.2 | +6.42% | 93.97% | 2.99% | 0.88% |
| 4 | 1050 | TH Titans | 500mA |
Manhoben Mixed
|
3:06.3 | +0:11.8 | +6.76% | 93.67% | 2.67% | 0.56% |
| 5 | 1044 | GW Geckos | 500mA |
Manhoben Mixed
|
3:07.3 | +0:12.8 | +7.34% | 93.17% | 2.15% | 0.03% |
| 6 | 1049 |
OK Bulldogs
|
500mA |
Manhoben Mixed
|
3:07.4 | +0:12.9 | +7.39% | 93.12% | 2.10% | -0.03% |
| 7 | 1063 | Jfk | 500mA |
Manhoben Mixed
|
3:07.5 | +0:13.0 | +7.45% | 93.07% | 2.05% | -0.08% |
| 8 | 1045 | ND Royals | 500mA |
Manhoben Mixed
|
3:20.4 | +0:25.9 | +14.84% | 87.08% | -4.69% | -6.97% |
| 9 | 1047 | FD/AOLG | 500mA |
Manhoben Mixed
|
3:28.9 | +0:34.4 | +19.71% | 83.53% | -9.13% | -11.50% |
| 10 | 1043 |
SH Dolphins
|
500mA |
Manhoben Mixed
|
3:34.0 | +0:39.5 | +22.64% | 81.54% | -11.80% | -14.22% |
| – | 1052 | FD/AOLG. | 500mA |
Manhoben Mixed
|
– | – | – | – | – | – |
| – | 1053 | OPEN MM | 500mA |
Manhoben Mixed
|
– | – | – | – | – | – |
|
500mA – Sottera
|
||||||||||
| Place | Bib | Name | Distance | Category | Time | Difference | % Back | % Winning | % Average | % Median |
| 1 | 1027 | TH Titans | 500mA | Sottera | 2:59.8 | – | – | 100% | 5.75% | 7.20% |
| 2 | 1024 |
SSHS Sharks
|
500mA | Sottera | 3:00.6 | +0:00.8 | +0.44% | 99.56% | 5.33% | 6.79% |
| 3 | 1026 |
AOLG Cougars
|
500mA | Sottera | 3:01.4 | +0:01.6 | +0.89% | 99.12% | 4.91% | 6.37% |
| 4 | 1030 |
JFK Islanders
|
500mA | Sottera | 3:05.2 | +0:05.4 | +3.00% | 97.08% | 2.91% | 4.41% |
| 5 | 1028 |
OK Bulldogs
|
500mA | Sottera | 3:13.2 | +0:13.4 | +7.45% | 93.06% | -1.28% | 0.28% |
| 6 | 1032 |
GH Panthers
|
500mA | Sottera | 3:14.3 | +0:14.5 | +8.06% | 92.54% | -1.86% | -0.28% |
| 7 | 1025 | ND Royals | 500mA | Sottera | 3:16.5 | +0:16.7 | +9.29% | 91.50% | -3.01% | -1.42% |
| 8 | 1031 | GW Geckos | 500mA | Sottera | 3:17.7 | +0:17.9 | +9.96% | 90.95% | -3.64% | -2.04% |
| 9 | 1023 | SJ Knights | 500mA | Sottera | 3:17.8 | +0:18.0 | +10.01% | 90.90% | -3.69% | -2.09% |
| 10 | 1029 |
SH Dolphins
|
500mA | Sottera | 3:21.1 | +0:21.3 | +11.85% | 89.41% | -5.42% | -3.79% |
| – | 1033 | OPEN SA | 500mA | Sottera | – | – | – | – | – | – |
|
500mA – Sotteru
|
||||||||||
| Place | Bib | Name | Distance | Category | Time | Difference | % Back | % Winning | % Average | % Median |
| 1 | 1035 | GW Geckos | 500mA | Sotteru | 2:35.5 | – | – | 100% | 7.80% | 6.41% |
| 2 | 1038 |
SSHS Sharks
|
500mA | Sotteru | 2:41.5 | +0:06.0 | +3.86% | 96.28% | 4.25% | 2.80% |
| 3 | 1037 | TH Titans | 500mA | Sotteru | 2:41.9 | +0:06.4 | +4.12% | 96.05% | 4.01% | 2.56% |
| 4 | 1040 |
JFK Islanders
|
500mA | Sotteru | 2:42.6 | +0:07.1 | +4.57% | 95.63% | 3.59% | 2.14% |
| 5 | 1041 | FD Friars | 500mA | Sotteru | 2:49.7 | +0:14.2 | +9.13% | 91.63% | -0.62% | -2.14% |
| 6 | 1034 |
OK Bulldogs
|
500mA | Sotteru | 2:53.3 | +0:17.8 | +11.45% | 89.73% | -2.75% | -4.30% |
| 7 | 1039 |
GH Panthers
|
500mA | Sotteru | 2:59.5 | +0:24.0 | +15.43% | 86.63% | -6.43% | -8.03% |
| 8 | 1036 | ND Royals | 500mA | Sotteru | 3:05.3 | +0:29.8 | +19.16% | 83.92% | -9.86% | -11.53% |
| – | 1042 | OPEN SU | 500mA | Sotteru | – | – | – | – | – | – |
|
500mA – Sotteru Mixed
|
||||||||||
| Place | Bib | Name | Distance | Category | Time | Difference | % Back | % Winning | % Average | % Median |
| 1 | 1055 | TH Titans | 500mA |
Sotteru Mixed
|
2:51.2 | – | – | 100% | 3.70% | 4.41% |
| 2 | 1054 |
SSHS Sharks
|
500mA |
Sotteru Mixed
|
2:52.3 | +0:01.1 | +0.64% | 99.36% | 3.08% | 3.80% |
| 3 | 1060 |
JFK Islanders
|
500mA |
Sotteru Mixed
|
2:53.5 | +0:02.3 | +1.34% | 98.67% | 2.41% | 3.13% |
| 4 | 1058 |
OK Bulldogs
|
500mA |
Sotteru Mixed
|
2:54.9 | +0:03.7 | +2.16% | 97.88% | 1.62% | 2.35% |
| 5 | 1059 | SJ Knights | 500mA |
Sotteru Mixed
|
2:59.1 | +0:07.9 | +4.61% | 95.59% | -0.74% | 0.00% |
| 6 | 1056 | FD/AOLG | 500mA |
Sotteru Mixed
|
2:59.7 | +0:08.5 | +4.96% | 95.27% | -1.08% | -0.34% |
| 7 | 1057 | ND Royals | 500mA |
Sotteru Mixed
|
3:01.6 | +0:10.4 | +6.07% | 94.27% | -2.15% | -1.40% |
| 8 | 1062 | GW Geckos | 500mA |
Sotteru Mixed
|
3:03.3 | +0:12.1 | +7.07% | 93.40% | -3.11% | -2.35% |
| 9 | 1061 |
GH Panthers
|
500mA |
Sotteru Mixed
|
3:04.4 | +0:13.2 | +7.71% | 92.84% | -3.73% | -2.96% |


Basketball
CNMI LT. GOVERNOR WAS A GUAM BASKETBALL STAR

Basketball
TAIWAN STAR COMING TO GUAM FOR HOOPS CAMP


Jiu-Jitsu
SAGE CRUZ CLIMBS TO #1 IN THE NATION

Basketball
CNMI LT. GOVERNOR WAS A GUAM BASKETBALL STAR
Basketball
TAIWAN STAR COMING TO GUAM FOR HOOPS CAMP
Jiu-Jitsu
SAGE CRUZ CLIMBS TO #1 IN THE NATION


QUICK HITS
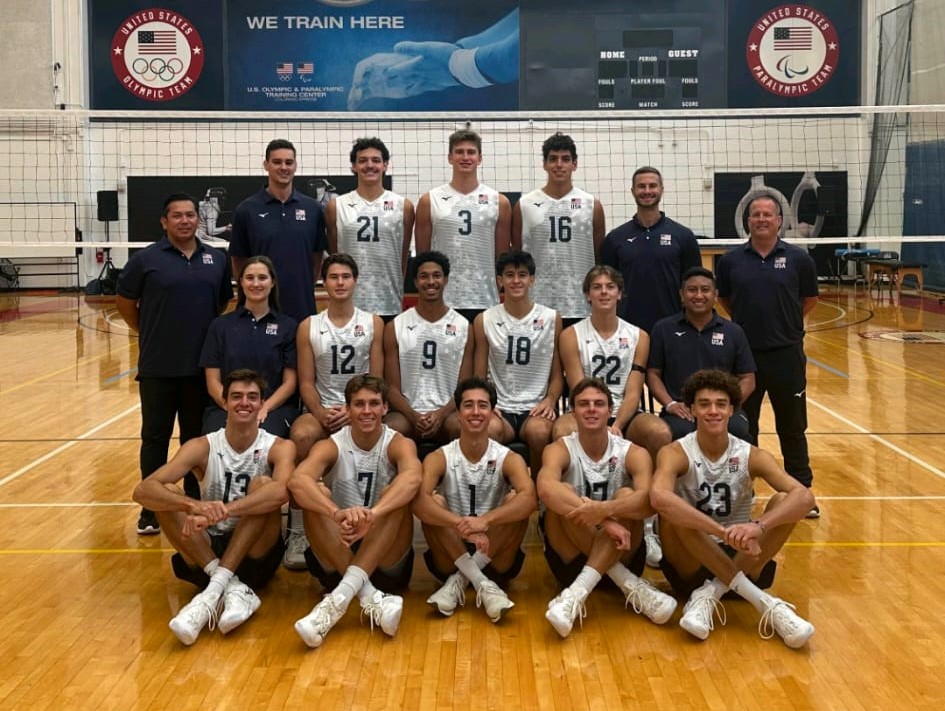
Donan Cruz is in China coaching Team USA in the FIVB U21 World Volleyball Championships.
———————————–
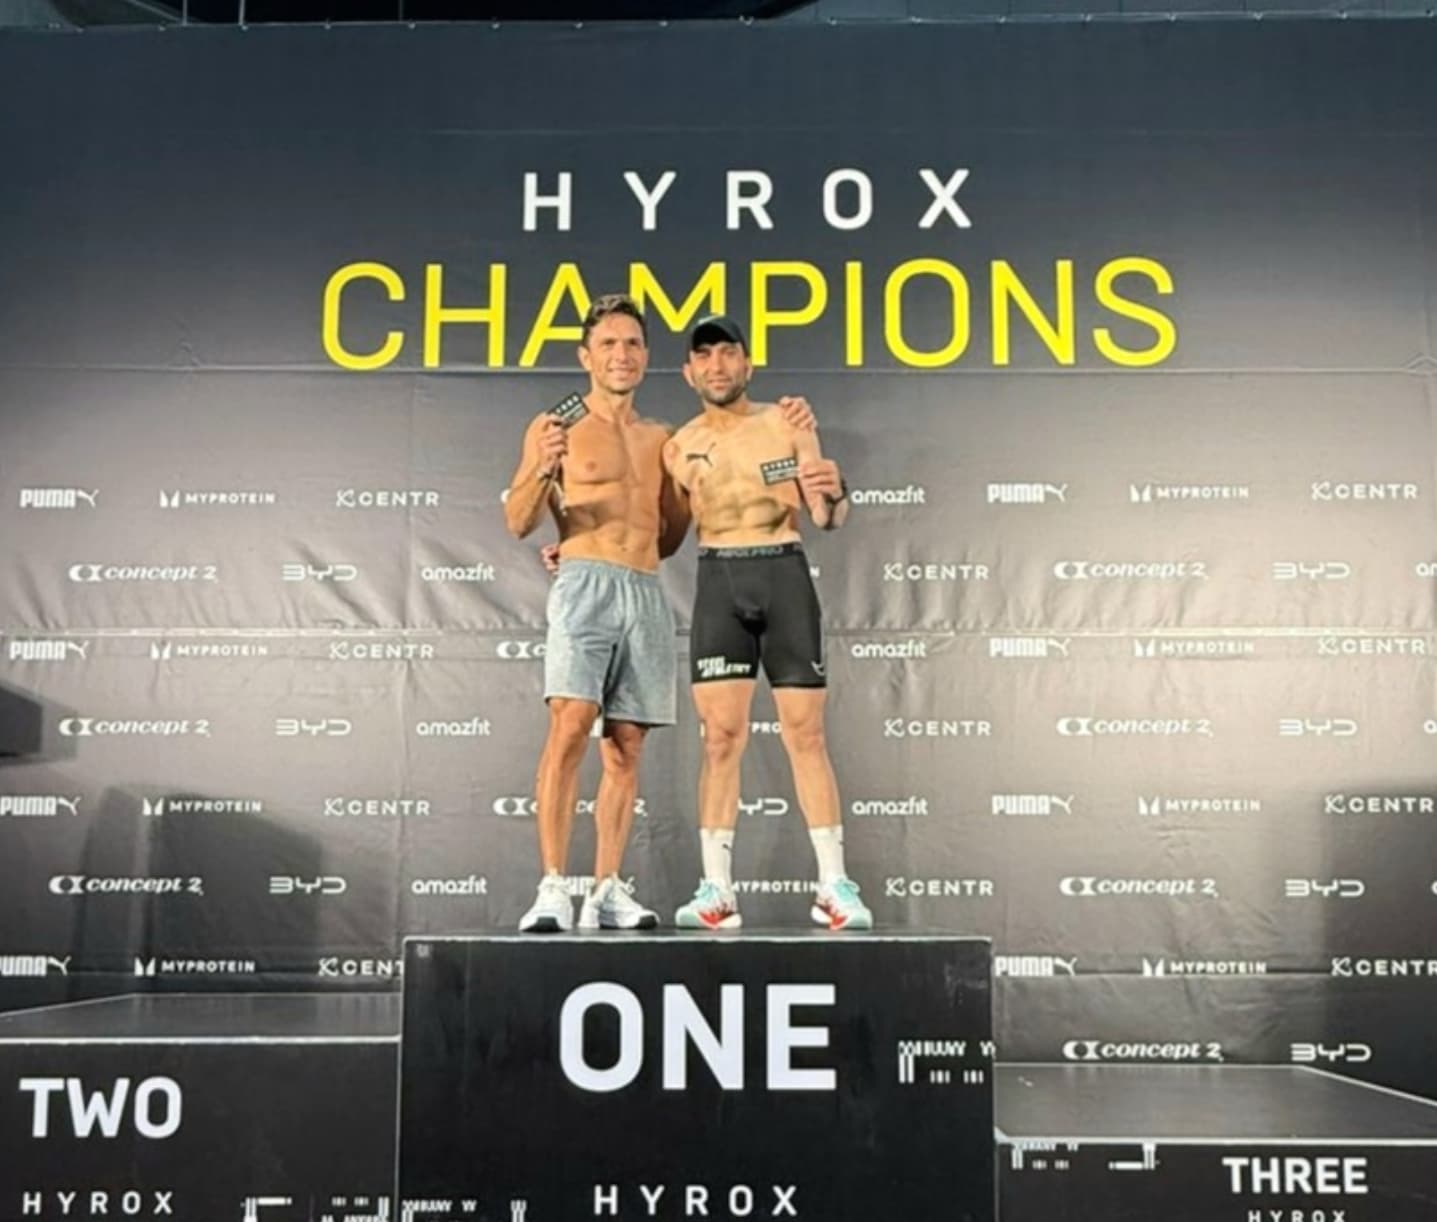
Guam’s Amnol Sobti and Rafaeli de Fraga won their age division and 9th overall at the HYROX Yokohama in Japan in a time of 1:02:11. Athletes from Guam gyms Unified, Custom Fitness and Steel Athletics participated.